


Sustainability
at Valcon
Valcon’s core mission is to ensure that our clients are in their best possible shape and fully prepared for the future.
This mindset also directs our approach to sustainability, ensuring that the sustainability challenges of not only our clients, but also our own business, are central to our transformations and solutions.
Committed to making change
We are dedicated to assisting organisations in overcoming challenges on their path to sustainability. We hold the conviction that to effect change, one must lead it. This is why our team is at the forefront of driving Valcon towards sustainability.
We champion collaboration beyond all boundaries and have engaged in global initiatives to foster enduring sustainable transformation.
Reducing our carbon footprint
Valcon has recently gathered data on our carbon footprint and established a comprehensive greenhouse gas inventory that covers Scope 1, 2, and 3 emissions across the Valcon Group, adhering to the Greenhouse Gas Protocol. This initiative enables us to compare our organisation’s carbon footprint with that of our industry and regional peers in real time and to derive insights necessary for setting science-based targets.
Check out our ESG Reports

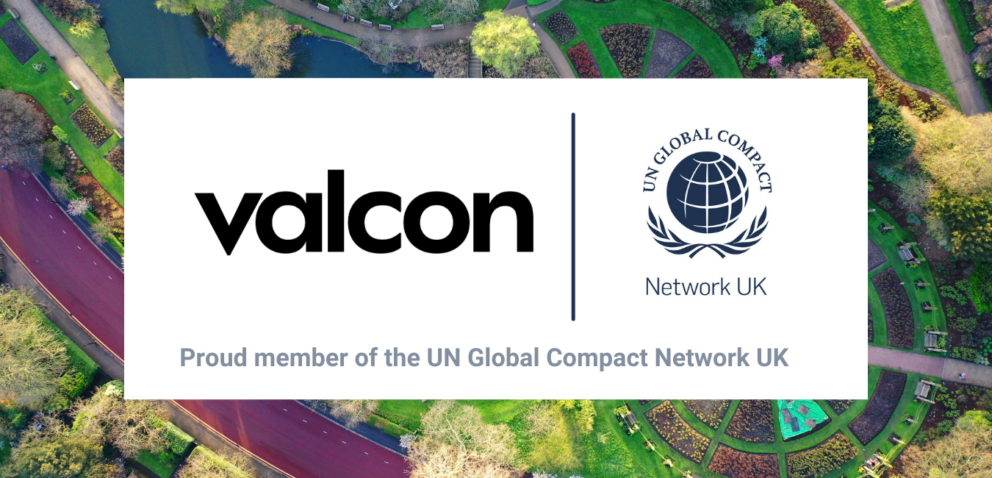
United Nations Global Compact
Since 2022, we have been members of the UNGC and remain deeply dedicated to adhering to the UNGC’s Ten Principles for responsible business practices. Valcon reports annually on our progress through the Communication on Progress (CoP). The CoP questionnaire assesses our performance in five key areas: governance, human rights, labour, environment, and anti-corruption, aligning with the UNGC Ten Principles. As part of our commitment, Valcon UK has joined the Climate Ambition Accelerator to equip ourselves with the necessary knowledge and skills. This initiative helps us accelerate our journey towards setting science-based emissions reduction targets in line with the 1.5°C pathway, aiming for net-zero emissions by 2050.
Empowering our people
Commitments to reducing scope 3 emissions, Valcon has introduced benefits to its employees to empower them to make more environmentally friendly lifestyle changes.

Valcon UK supports The UK Green Commute Cycle 2 Work Scheme
The Cycle to Work scheme is a tax exemption initiative by the UK Government, enabling employers to provide employees with bicycles and cycling safety equipment as a tax-free benefit.
Valcon employees can take advantage of this scheme to save on fuel and parking expenses while achieving fitness goals, leading to a healthier body and mind.

Volunteering at Valcon
We believe in giving back, whether through utilising our skills and knowledge or by getting hands-on. We want to make a positive impact on our communities and the environment.
We encourage our people to participate in our environmental and community service programmes, offering a range of activities such as locating oil spills through satellite imaging with knowledge from our data capability or making elderly homes more energy efficient.

Valcon supports the Electric Dreams Car Scheme provided by Octopus EV.
The scheme allows Valcon employees who have completed their probationary period, to get a new car through salary sacrifice and includes several optional extras in terms of breakdown cover, servicing, MOT, repairs, tax and additional discounts where applicable.
Sustainable procurement
Sustainable procurement is a key component of Valcon’s commitment to reducing our environmental impact. Our sustainable procurement policy governs operations in the entire Valcon group.
It is Valcon’s ambition to reduce emissions by 5% per FTE per annum. With our sustainable procurement policy, we aim to:
- Reduce our carbon footprint and monitor our supply in terms of energy consumption and greenhouse gas emissions
- Reduce waste and disposal in our facilities, canteen and dining room and sort our waste according to local regulations
- Minimise the environmental impact of travel and commuting in service by promoting digital alternatives and environmentally friendly travel options
- Choose suppliers who align with our sustainability conditions

Case studies

Insights


How can we help you?
At Valcon, we know how important running a sustainable business is. And we can help you do that effectively. We are trusted by some of the biggest brands to deliver their sustainability programmes.
Check out how we can help you make change.
Get in touch
Leave us a message and we will get back to you.