


Geographical visualisations in Mendix
At my job at Valcon, I have built many applications over the past 10 years. For a lot of our clients, the geographical aspect of their business is an important part of the day-to-day work. Think for example of infrastructure companies owning assets, construction companies doing projects at a variety of places and utility companies using resources. Most of the Mendix projects we do therefore have a geographical component. In this type of project, it is important to connect the day-to-day business to geographical visualisations.
One of the first steps in connecting the day-to-day business to geographical visualisations is to decide which platform to use. Two main players commonly used for these visualisations are Google (Maps) and Esri (ArcGIS). In my previous blog, I shared my learnings on how I built a generic but fully customisable Google Maps widget. Today, I want to share my learnings on building another great – and freely available – ArcGIS widget.
ArcGIS vs. Google Maps
Let’s start with a quick comparison between ArcGIS and Google Maps. When it comes to more advanced GIS needs, ArcGIS is a richer platform in terms of out-of-the-box functionality. ArcGIS is built to support business operations in their day-to-day work by extending various out-of-the-box GIS features. When building a (Mendix) widget, one needs an API to integrate both platforms.
The ArcGIS API is a complete API with heaps of functions catering for all kinds of geographical needs. With just a few lines of code, the ArcGIS can help you to group your locations in layers, create a legend for your layers or enable the users to toggle visibility in layers. In Google Maps, on the other hand, you need to build such options by yourself. Next to that, the ArcGIS comes with its own geospatial database, which removes the need to store the locations yourself. One downside though, is that there is no full React-based ArcGIS API available just yet, whereas Google Maps, has multiple.
Upgrading ArcGIS widget
For some time already Mendix is in the process of moving its complete front end from Dojo to React. Around five years ago, I built an ArcGIS widget using Dojo which has been successfully used by many clients with close to 1000 downloads.
The widget was built with the old Mendix Client API and the now outdated ArcGIS JavaScript API v3. Upgrading the widget was going to be a major challenge. I had to completely rewrite the ArcGIS widget based on React and TypeScript, the newest ArcGIS API and the Mendix Pluggable widget API. The challenging process can be summarised with the below six observations:
1. No full React-based version
The first challenge was the fact that there is no full React-based version of the ArcGIS API. For Google Maps, there are multiple. I guess the main reason is that the ArcGIS API is very extensive, hence creating and maintaining a React-based version of it is a huge effort. In the end, I wrote the full widget with an onload event using the useEffect hook and some React Refs to make sure I could always access the right version of the data throughout each rerender React deems necessary.
2. The ArcGIS API is huge!
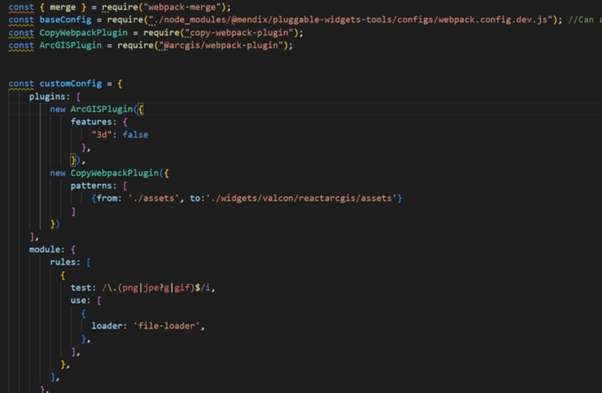
Since the ArcGIS JavaScript API has such an extensive set of features, all specific features are nicely built into separate JavaScript files. These files need to be loaded with the widget as well. In the current version, almost 25 MB of JavaScript/CSS files need to be loaded for the ArcGIS API to properly function. For this to work, the most important part is to add the below code to the file webpack.config.dev.js.
3. The main ArcGIS API objects need a Mendix counterpart
Via the pluggable widgets API, the new ArcGIS widget can now be fed via all data sources like nanoflows. As a result, the Mendix objects will be available in the widget. The Mendix objects (points, layers) need a translation to their ArcGIS counterpart to appear on a map via the ArcGIS API. The widget needs to keep track of two arrays of all objects: one in the Mendix objects (data source) and one in typings of the ArcGIS JS API. For this, I used React Refs to make sure I always have the right version of the objects during each rerender React would deem necessary.
4. Be aware of what to create once and what to update
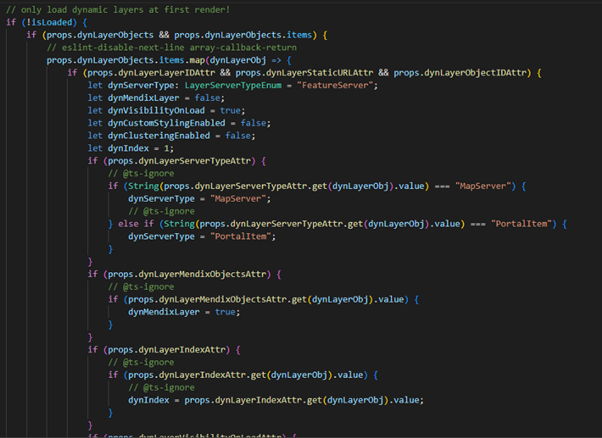
I added an isLoaded boolean to the State of the ArcGISContainer component, which is also shared with its parent ReactArcGIS component as a property. In this way, both the ArcGISContainer and ReactArcGIS component always ‘know’ whether the widget was already loaded. Things that are only loaded once are the layers, both the static configured layers and the dynamic layers from the data source:
5. Only rerender if data sources changed
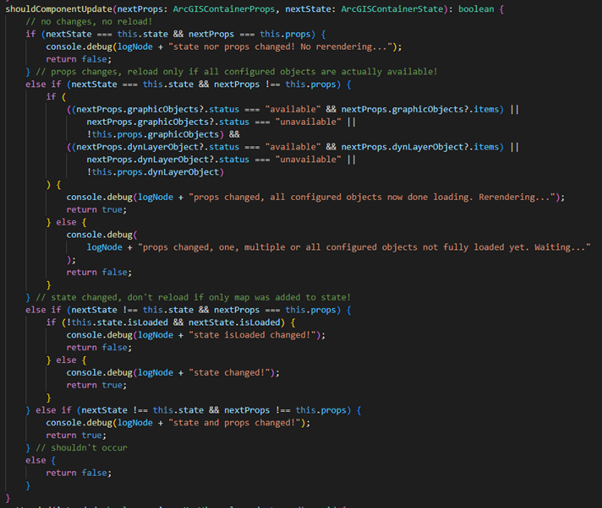
React has its own mechanism of rerendering in relation to the status of data sources in Mendix. Data sources can have multiple statuses and for each status change (i.e. ‘Loading’ > ‘Available’) a rerender is triggered. Sometimes, this results in unnecessary rerendering which prevents the map from working smoothly. Therefore, I implemented a boolean function which checks the availability of the data sources if the main data sources, layers and GIS objects have an ‘Available’ status. Only then the widget will rerender itself.
6. A Custom Popup: Use both ArcGIS and Mendix ‘owned’ attributes
One of the great features of the widget is that it can connect Mendix and ArcGIS and access both ArcGIS attributes and Mendix-owned attributes. In this way, an info window pop-up can access and show data from both platforms. For this, I have created my own CustomPopup component and PopupUtils tsx file. Because of a shortcoming in the Pluggable widgets API, it was still necessary to load the client API to get access to all attributes of an object not previously loaded via the data source.
Results
The result of the rewrite is a future-proof ArcGIS widget with even more features such as:
- dynamically loading layers
- configuring multiple layers of objects also existing in Mendix
- enabling marker clustering per layer
- being able to fully configure the info window content with fields owned in both ArcGIS and Mendix
- the option to add three sub widgets (location search, toggle layer visibility, legend) to the map for enhanced user interaction
Demo project
It can be tricky to sort out the configurations needed for each scenario (listen to the grid, all objects, marker clustering, etc.). Therefore, I have created a fully working demo project that will explain the setup for each scenario on the screen.
Conclusion
The rewrite of the ArcGIS widget to React TypeScript turned out to be a real challenge, but the result is even better than its predecessor, both in terms of functionality and user interface. In case of questions use the Mendix forum, contact me or dig into the publicly available code on GitHub yourself.
Want to learn more? If you would like to learn more, please email [email protected] and we’ll be in touch right away.